Revenue per month and per room
Updated on 2026-09-30
On Management → Insights → Statistics, the key figures are followed by three blocks about your revenue: the chart per month, the revenue per room and a monthly table with quarters. All amounts include VAT and come from your invoices.
Revenue per month (stacked by room)
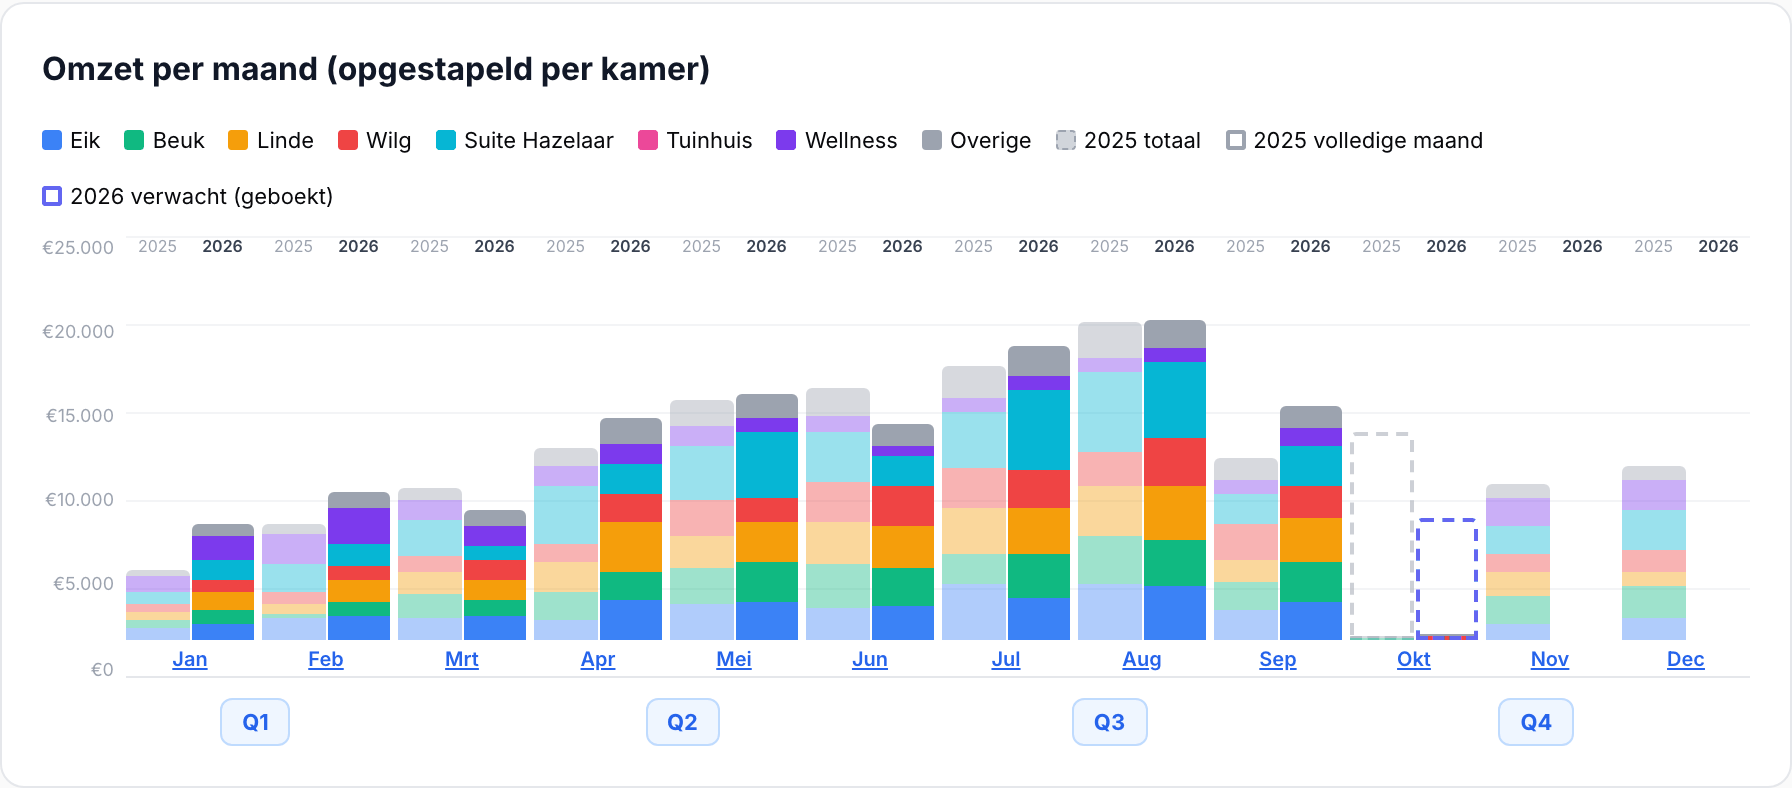
Each month has a stacked bar: one colour per room, plus Wellness and a grey Other segment. The bar adds up to exactly your monthly revenue.
- Other groups everything that is not a room or wellness: breakfast, tourist tax, pet fee, the honesty bar, …
- Next to each bar, last year is shown in light grey, so you can immediately compare each month with the same month last year.
- Rooms you have renamed are recognised: their past revenue stays with the same room.
The current month
For the month you are in, the chart shows two extras:
- Last year, full month as a dotted line, with the part up to the same day last year inside it. That way you can see whether you are ahead or behind, without comparing half a month with a full one.
- Expected (booked): a dotted line above your bar. That is what has already been invoiced plus the confirmed bookings currently in-house or still arriving later this month. Options, cancellations and stays that have already left are not included. So it is a realistic final amount, not an estimate.
Details per month or quarter
Click the month name below a bar for the details of that month: the revenue per room and per type of product (overnight stays, wellness, breakfast, extras, tourist tax, pet fee), each next to last year. With the Q1 – Q4 buttons below the chart, you open the same details for a whole quarter.
Revenue per room and product breakdown
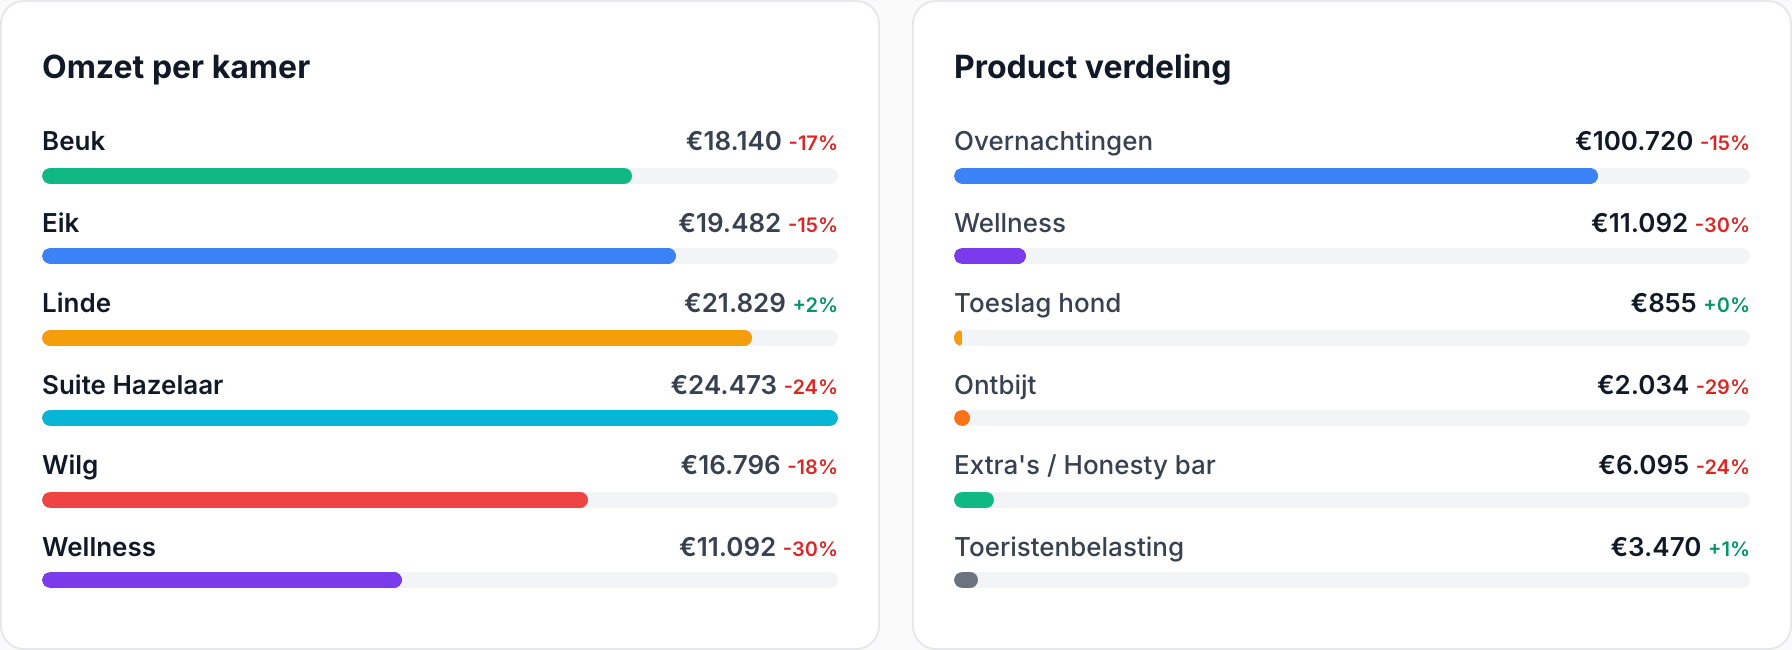
- Revenue per room: a bar per room with the percentage difference compared with last year. Useful to see which room earns the most and which one lags behind. If your property has a wellness area, it appears as its own bar among the rooms.
- Product breakdown: how much of your revenue comes from overnight stays and how much from wellness, breakfast, extras, tourist tax and the pet fee, also with the difference compared with last year.
Monthly overview
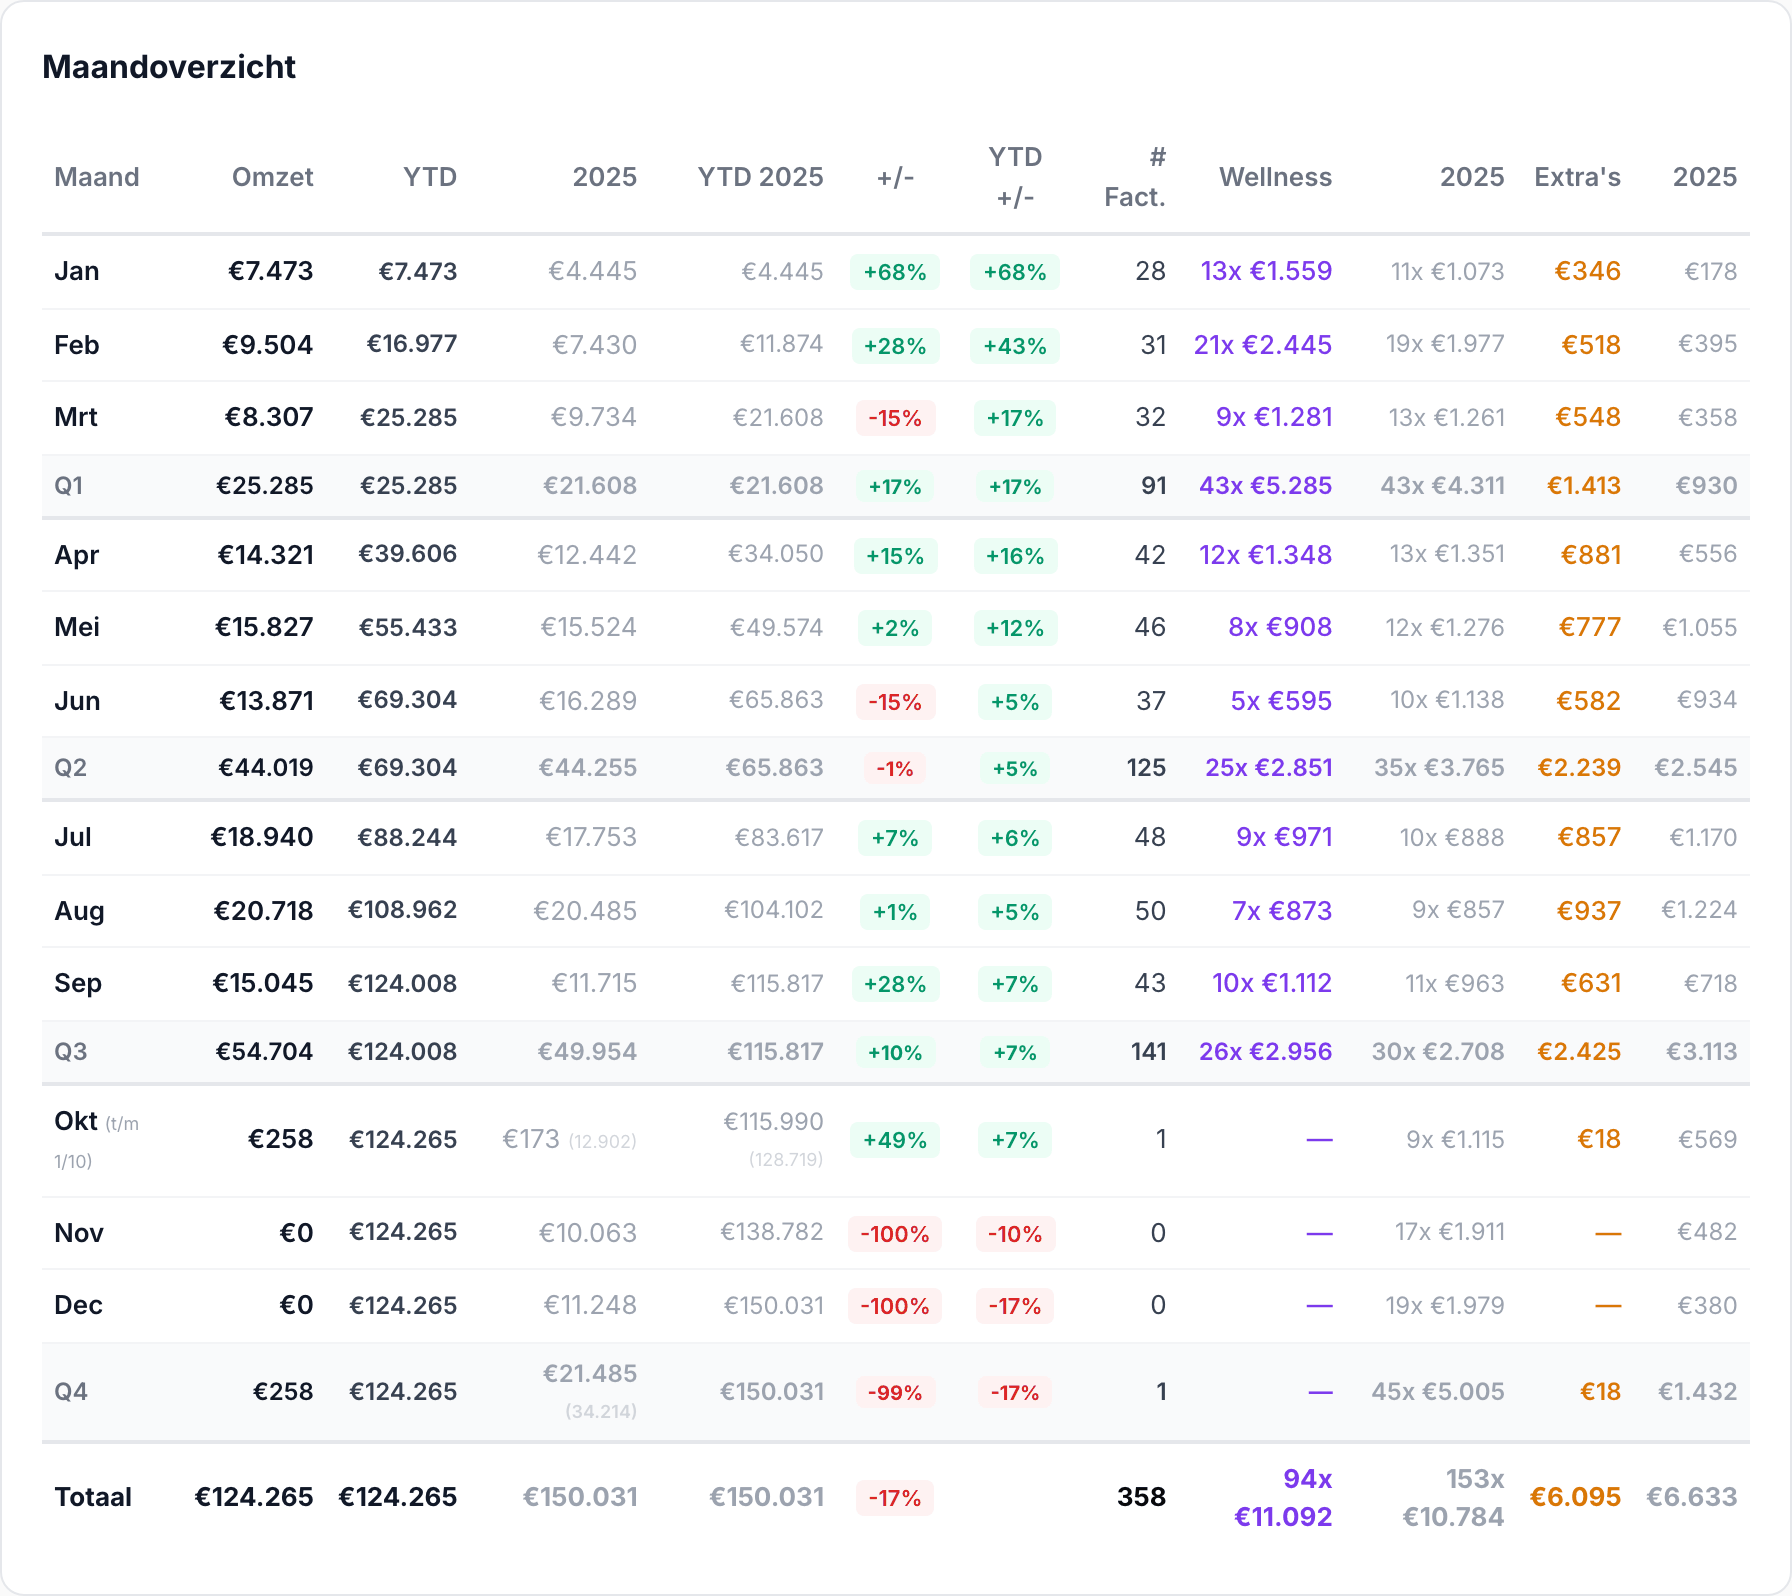
The table lists all months one below the other, with a quarterly subtotal after every three months and the year total at the bottom. For each month you see:
- Revenue and YTD (the year's total up to and including that month);
- the same two figures for last year, and the difference (+/- and YTD +/-);
- the number of invoices (# Inv.);
- the revenue from Wellness and Extras, each with last year alongside.
Good to know
- A stay counts in the month of its invoice. If you invoice at departure, a stay from 30 September to 2 October falls in October.
- Proformas do not count as revenue; they do appear in the expected (booked) line as long as the guest has yet to arrive.
- If you work with several properties, first select the right property at the top of the sidebar.
See also: Statistics — how to read the dashboard.