Guest origin and revenue per channel
Updated on 2026-09-30
On Management → Insights → Statistics there are three blocks about who your guests are and how they find you: the world map, origin over time and revenue per channel.
Guest origin (world map)
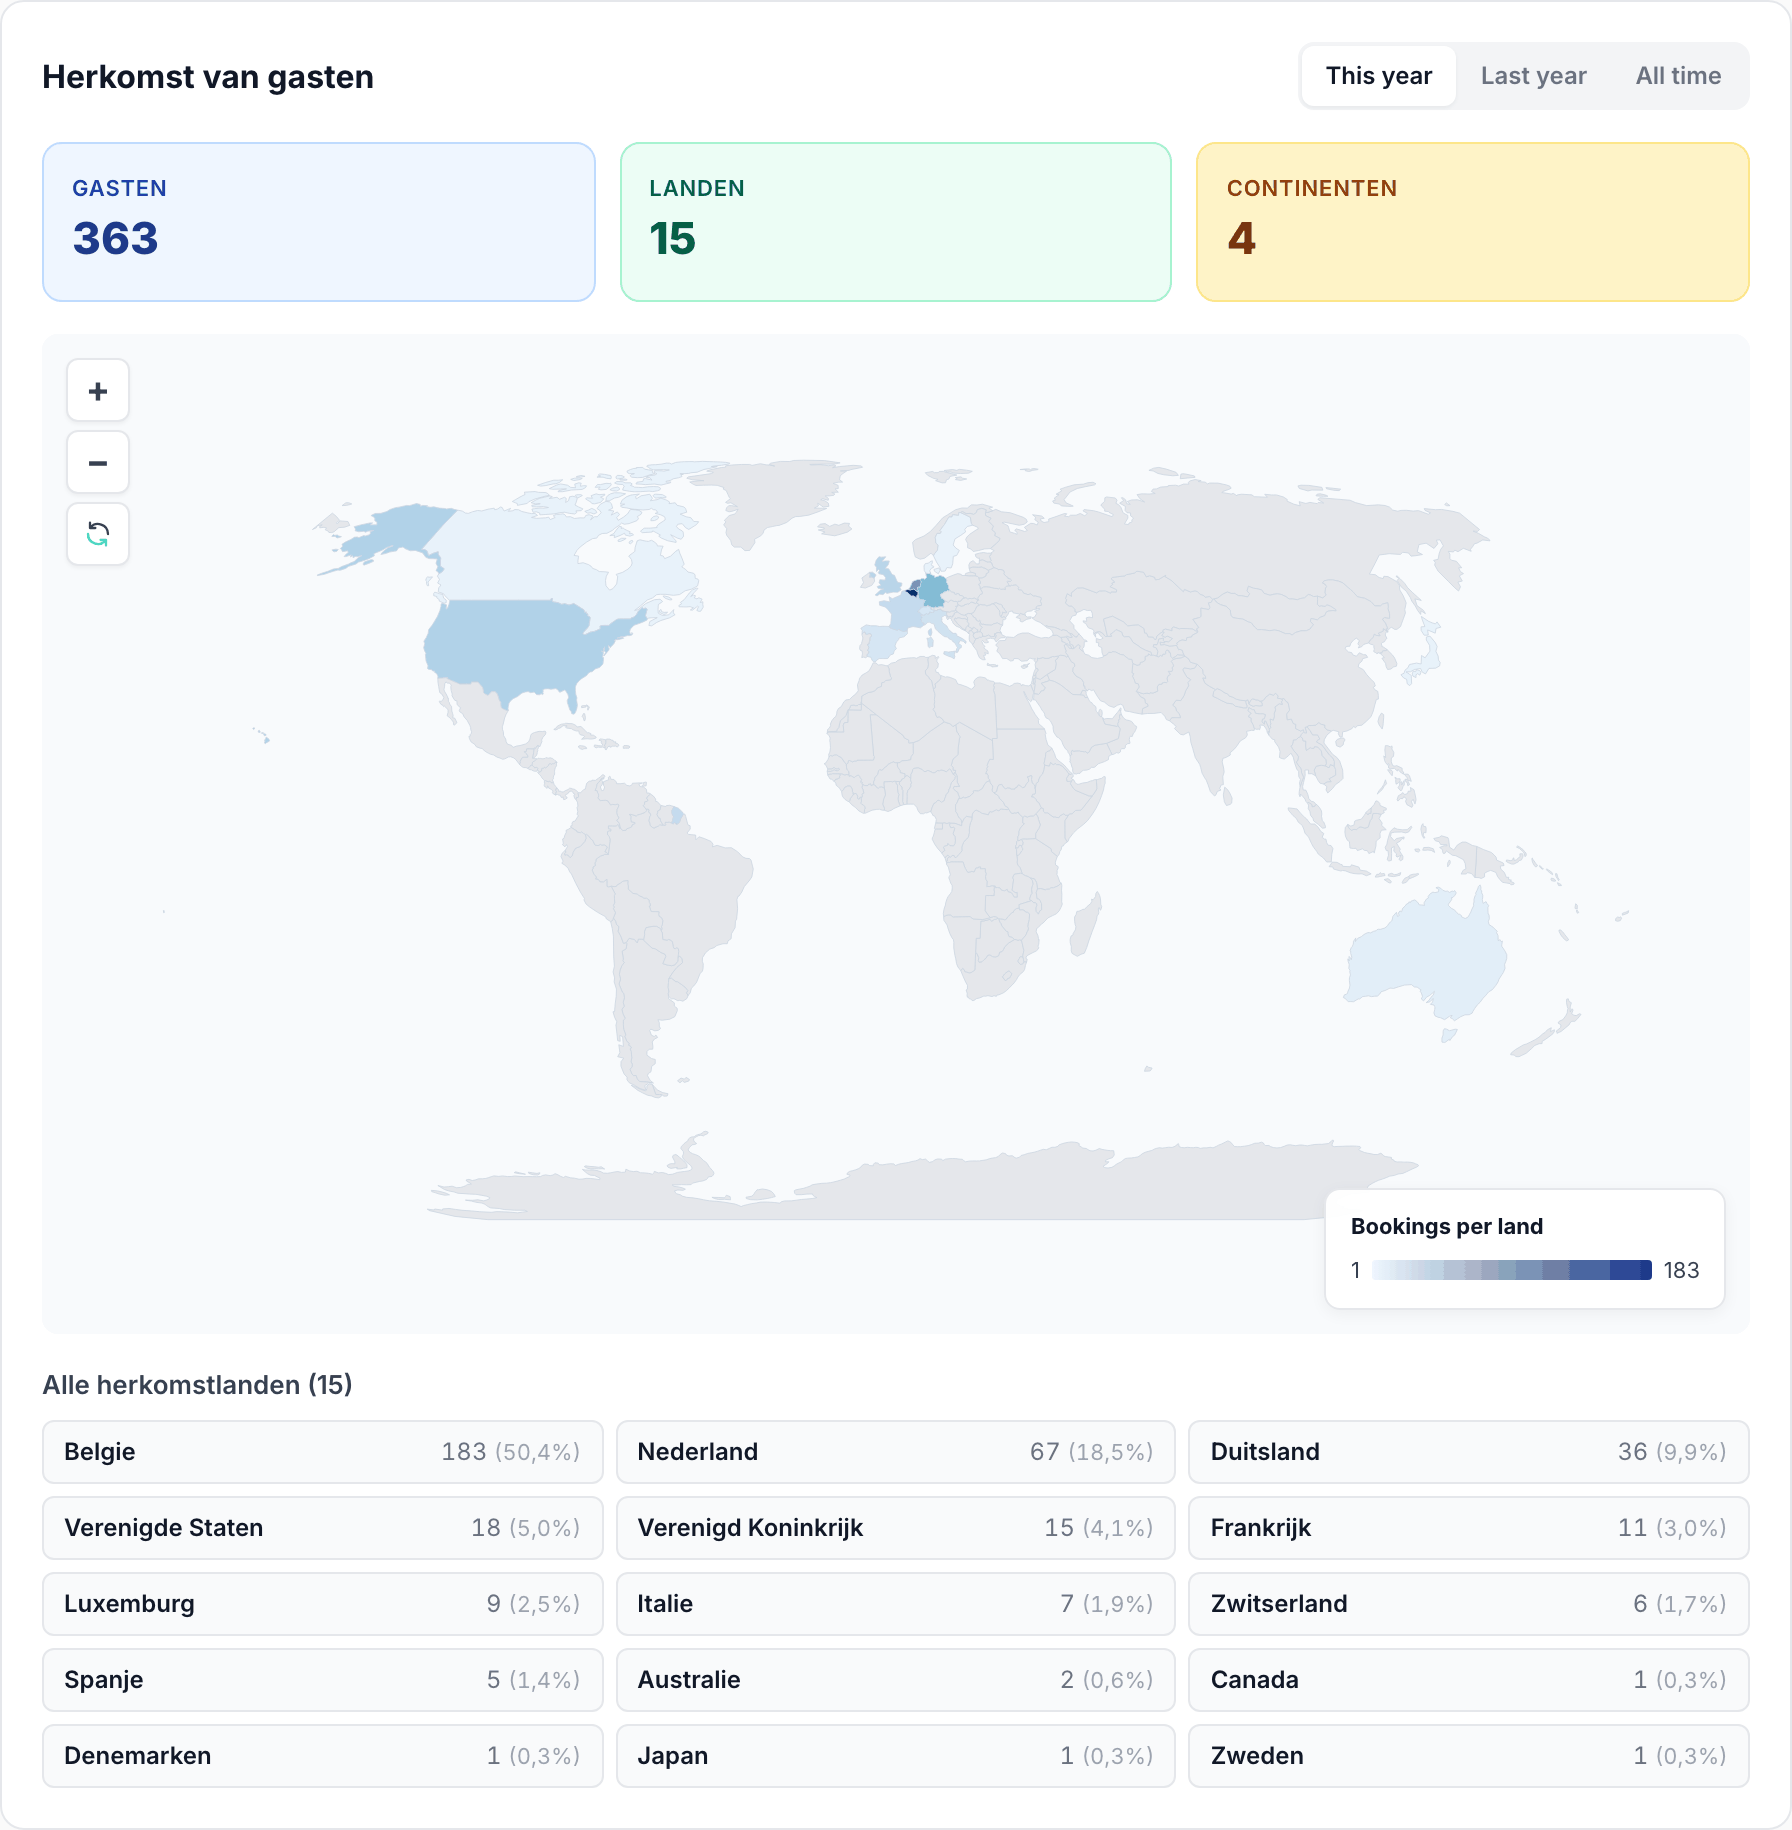
The map colours each country according to the number of bookings coming from it: the darker, the more. Below the map is the full list of countries with the number of bookings and the revenue per country.
- Switch at the top between This year, Last year and All time. "This year" follows the year you selected at the top of the page.
- Click a country for the details.
- The country comes from the booking itself. If nothing is filled in there, BedFlow takes the country from the customer record.
- A booking counts in the year of arrival.
Tip: always fill in the country for manual bookings. Guests from Booking.com and other channels have their country passed on automatically.
Origin over time
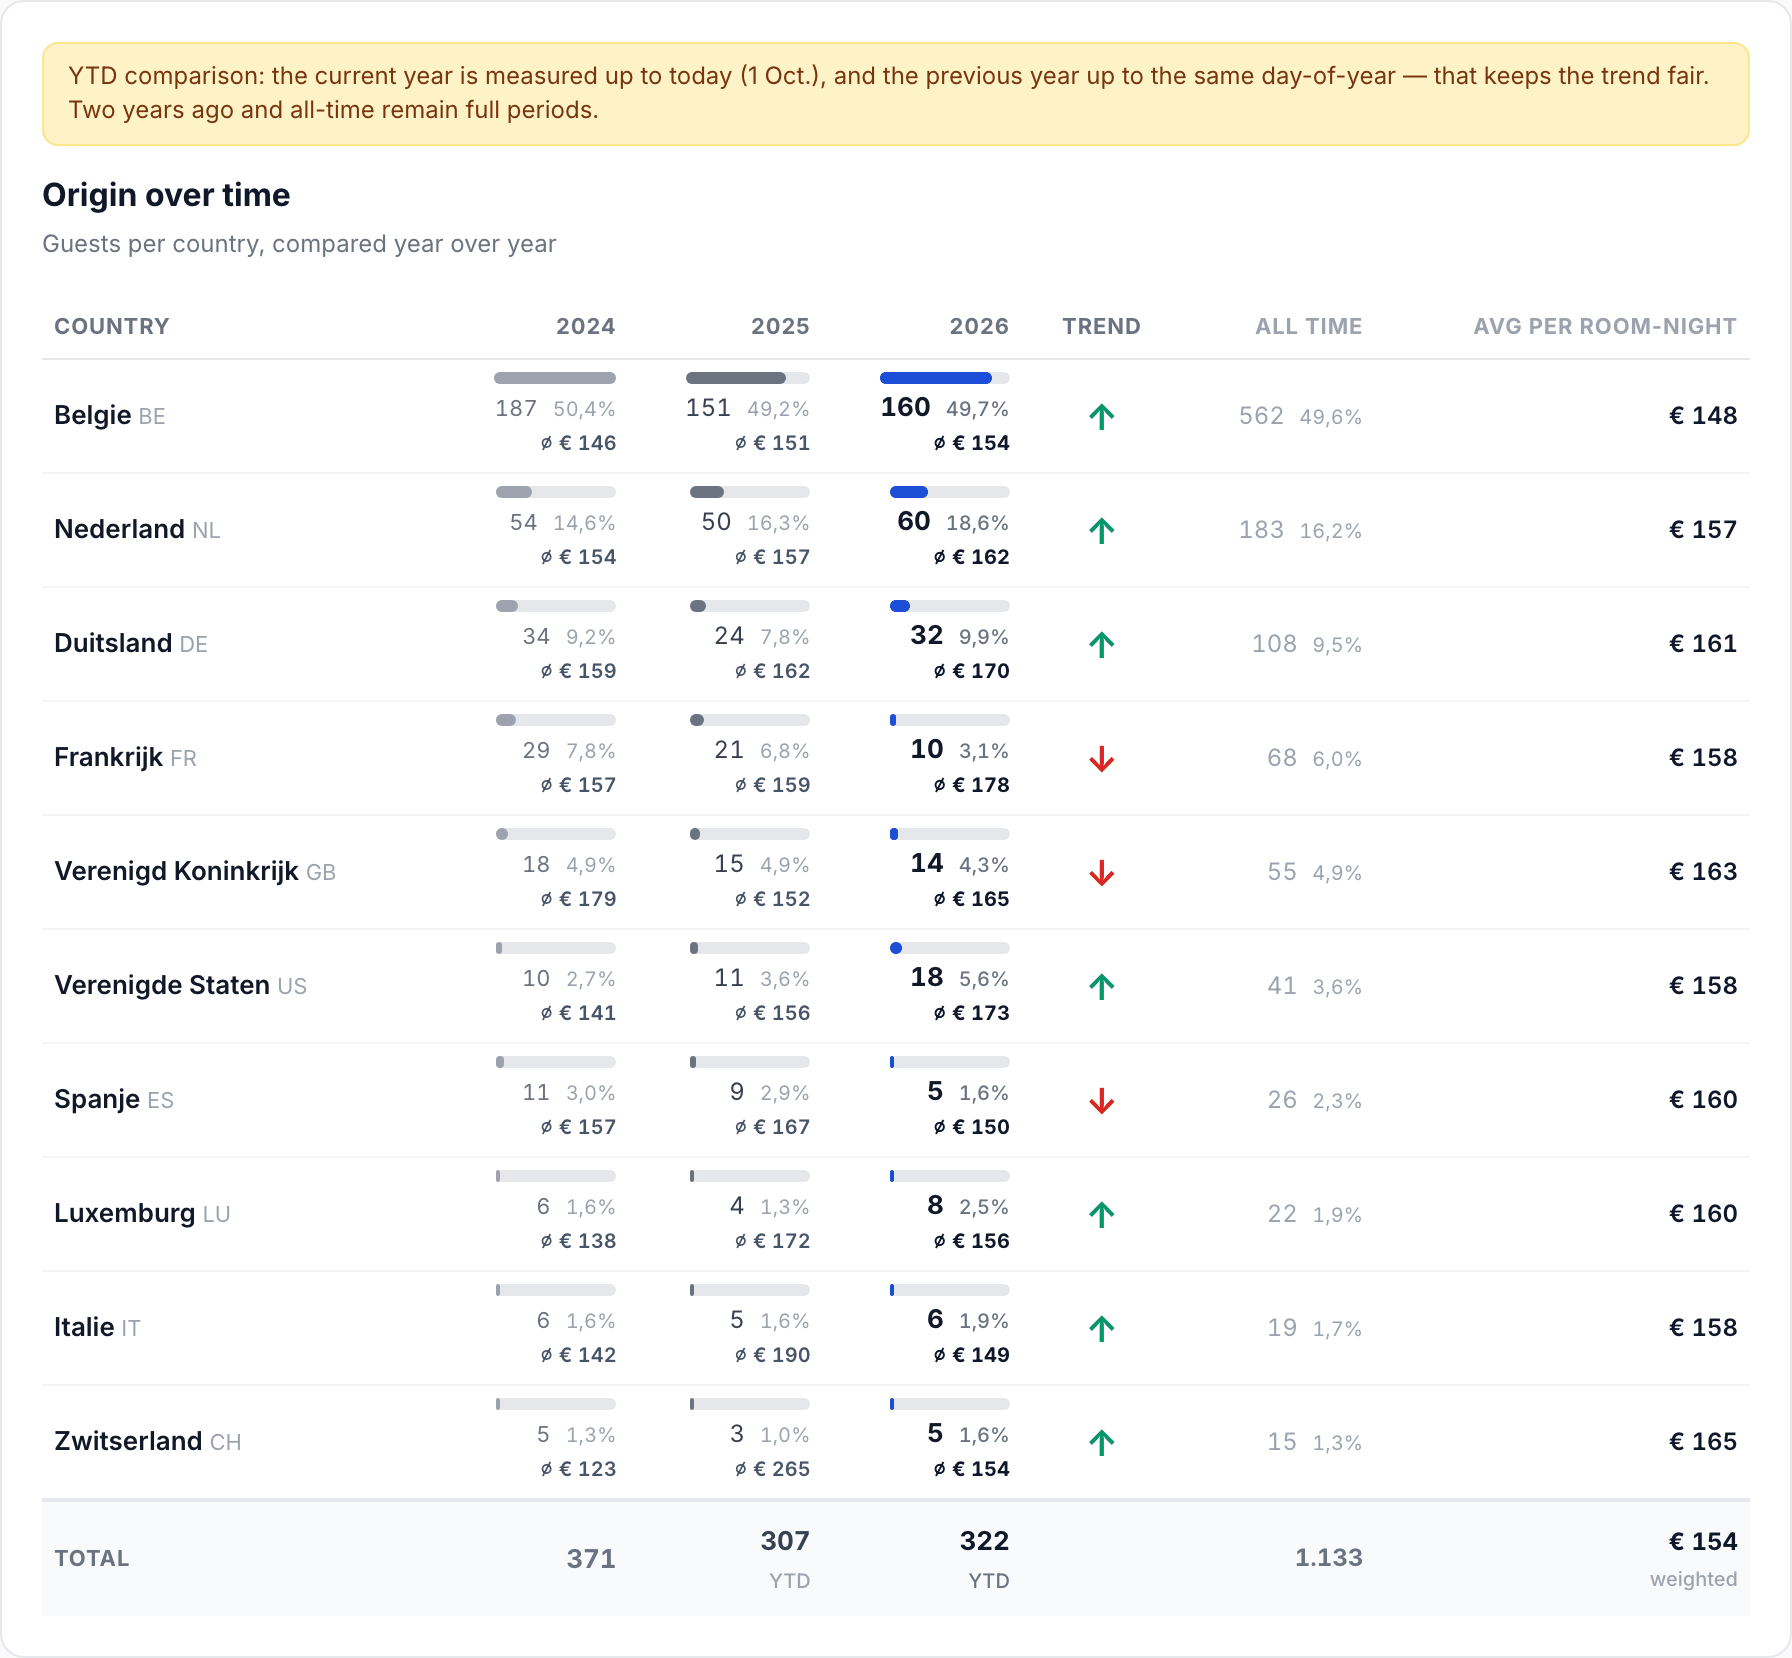
Your top 10 countries side by side for the last three years and All time, with a trend arrow. That way you can see, for example, whether the share of Dutch guests is growing or shrinking.
- Avg per room-night is what a guest from that country spends on average per room per night, including VAT. Long stays and bookings with several rooms are split fairly: 3 nights in 1 room for €600 counts as 3 × €200. A higher amount points to more expensive rooms, wellness or more extras.
- The current year is compared up to today; last year is counted up to exactly the same day. The older years and "All time" are full periods.
Revenue per channel
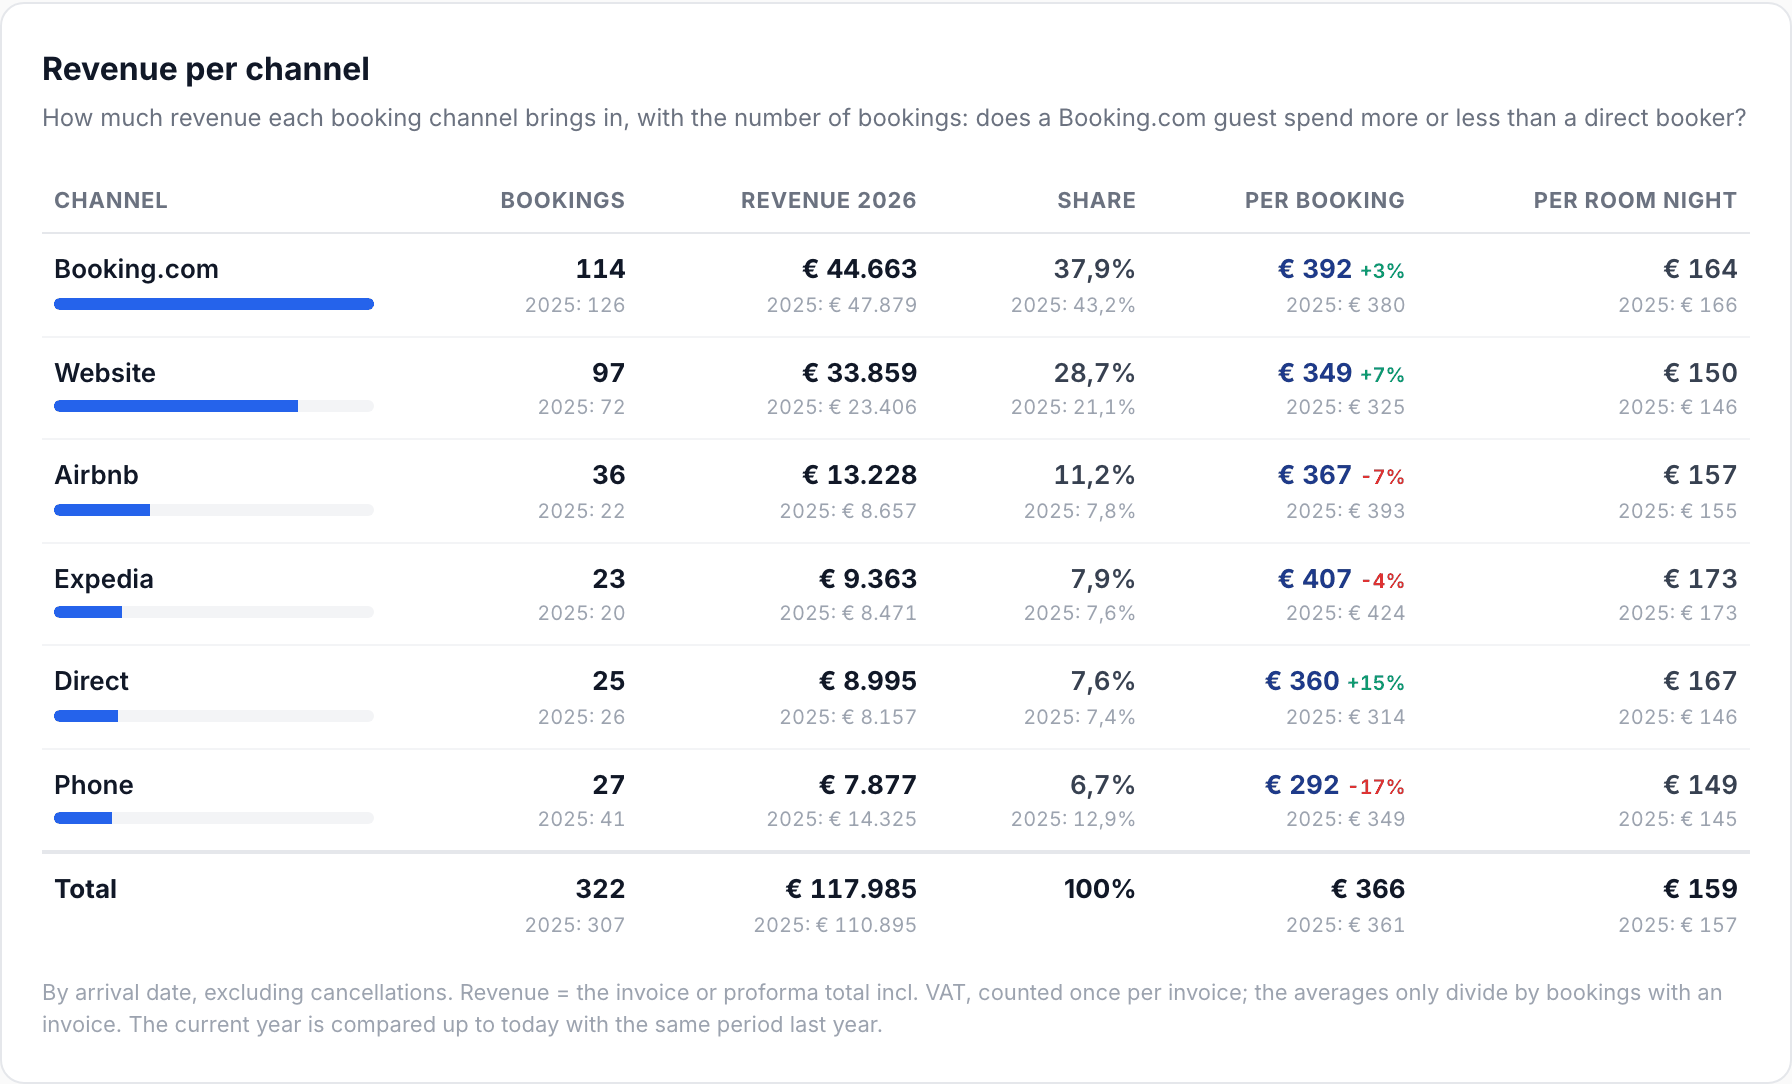
For each booking channel (direct, Booking.com, Airbnb, Expedia, …) you see:
| Column | Meaning |
|---|---|
| Bookings | The number of bookings via that channel. |
| Revenue | The revenue from those bookings, including VAT. |
| Share | What share of your total revenue comes in through that channel. |
| Per booking | The average revenue per booking, with the percentage difference compared with last year. |
| Per room night | Revenue divided by rooms × nights, so that a long stay and a short stay compare fairly. |
Below each figure, last year's value is shown in small print.
This answers the question every operator asks: does a guest via Booking.com spend more or less than someone who books directly, and does the commission pay for itself? If "per room night" via an OTA is the same as direct, every OTA booking effectively costs you the full commission. If you want to work out when advertising for direct bookings pays off, read Ad target.
How it is counted
- By arrival date, excluding cancelled bookings.
- Revenue = the total of the invoice or proforma including VAT, once per invoice, even if several bookings are attached to it.
- The averages only divide by bookings with an invoice or proforma.
- The current year is compared up to today with the same period last year.
See also: Statistics — how to read the dashboard and Cancellations and booking window.